A college student applies henna, the Indian tradition of painting elaborate designs on the skin. (Photo: University of Illinois Springfield)
Immigrants from India first arrived in the United States in small numbers during the early 19th century, primarily as low-skilled farm laborers. In recent decades the population has grown substantially, with 2.4 million Indian immigrants resident in the United States as of 2015. This makes the foreign born from India the second-largest immigrant group after Mexicans, accounting for almost 6 percent of the 43.3 million foreign-born population.
In 1960, just 12,000 Indian immigrants lived in the United States, representing less than 0.5 percent of the 9.7 million overall immigrant population. Migration from India swelled between 1965 and 1990 as a series of legislative changes removed national-origin quotas, introduced temporary skilled worker programs, and created employment-based permanent visas. In 2016, Indians were the top recipients of high-skilled H-1B temporary visas and were the second-largest group of international students in the United States.
Today, the majority of Indian immigrants are young and highly educated, and have strong English skills. Many work in science, technology, engineering, and math (STEM) fields. From 1980 to 2010, the population grew more than eleven-fold, roughly doubling every decade (see Figure 1). In 2013, India and China supplanted Mexico as the top sources of newly arriving immigrants in the United States.
Figure 1. Indian Immigrant Population in the United States, 1980-2015

Sources: Data from U.S. Census Bureau 2010 and 2015 American Community Surveys (ACS), and 1980, 1990, and 2000 Decennial Census.
The United States is the third most popular destination for Indian migrants worldwide, after the United Arab Emirates and Pakistan, according to mid-2015 estimates by the United Nations Population Division. Other top destinations include Saudi Arabia (1,894,000), Kuwait (1,062,000), Oman (778,000), and the United Kingdom (777,000).
 Click here to view an interactive map showing where migrants from India and other countries have settled worldwide.
Compared with the overall foreign- and native-born populations, immigrants from India on average are significantly better educated, more likely to be employed in management positions, and have higher household incomes. In fiscal year (FY) 2015, nearly half of Indians who obtained lawful permanent residence in the United States (also known as receiving a green card) did so through employer sponsorship. The remainder qualified as immediate relatives of U.S. citizens or through other family-sponsored channels.
Using data from the U.S. Census Bureau (the most recent 2015 American Community Survey [ACS] and pooled 2011-15 ACS data), the Department of Homeland Security’s Yearbook of Immigration Statistics, and the World Bank’s annual remittance data, this Spotlight provides information on the Indian immigrant population in the United States, focusing on its size, geographic distribution, and socioeconomic characteristics.
Click on the bullet points below for more information:
- Distribution by State and Key Cities
- English Proficiency
- Age, Education, and Employment
- Income and Poverty
- Immigration Pathways and Naturalization
- Health Coverage
- Diaspora
- Remittances
Distribution by State and Key Cities
In 2011-15, more than half of immigrants from India resided in five states: California (20 percent), New Jersey (11 percent), Texas (9 percent), New York, and Illinois (7 percent each). The top four destination counties were Santa Clara County in California, Middlesex County in New Jersey, Cook County in Illinois, and Alameda County in California. Together, these four counties accounted for about 15 percent of the total Indian population in the United States.
Figure 2. Top Destination States for Indian Immigrants in the United States, 2011-15
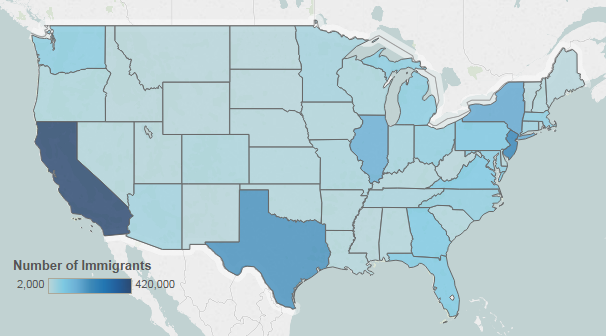
Note: Pooled 2011-15 ACS data were used to get statistically valid estimates at the state level for smaller-population geographies. Not shown are populations in Alaska and Hawaii, which are small in size; for details, visit the Migration Policy Institute (MPI) Data Hub for an interactive map showing geographic distribution of immigrants by state and county, available online.
Source: MPI tabulation of data from U.S. Census Bureau pooled 2011-15 ACS.
 Click here for an interactive map that shows the geographic distribution of immigrants by state and county. Select India or another country from the dropdown menu to see which states and counties have the most Indian immigrants.
As of 2011-15, the metropolitan areas with the most Indian immigrants were the greater New York, Chicago, San Jose, and San Francisco areas. These four metro areas were home to one-third of Indians in the United States.
Figure 3. Top Metropolitan Destinations for Indian Immigrants in the United States, 2011-15

Note: Pooled 2011-15 ACS data were used to get statistically valid estimates at the metropolitan statistical-area level for smaller-population geographies.
Source: MPI tabulation of data from U.S. Census Bureau pooled 2011-15 ACS.
Table 1. Top Concentrations by Metropolitan Area for Immigrants from India, 2011-15

Source: MPI tabulation of data from the U.S. Census Bureau pooled 2011-15 ACS.
 Click here for an interactive map showing the concentration of immigrants by metropolitan area. Select India or another origin country from the dropdown menu to see which metro areas have the most immigrants.
Though they come from diverse linguistic backgrounds, immigrants from India were more likely to be proficient in English than the overall foreign-born population. In 2015, just 26 percent of Indian immigrants (ages 5 and over) reported limited English proficiency, compared to 49 percent of the total foreign-born population.
Approximately 11 percent of Indian immigrants spoke only English at home (versus 16 percent of all immigrants), while the rest spoke a variety of languages, including Hindi (25 percent), Telugu (13 percent), Guajarati (12 percent), Tamil (9 percent), and Punjabi (8 percent).
Note: Limited English proficiency refers to those who indicated on the ACS questionnaire that they spoke English less than “very well.”
Age, Education, and Employment
The median age for Indian immigrants was 39 years, younger than the overall foreign-born population (44 years) and older than the U.S. born (36 years).
Both Indians and the overall immigrant population were much more likely than the native born to be of working age. In 2015, 82 percent of Indian immigrants were between ages 18 and 64, compared to 60 percent of the U.S. born (see Figure 4).
Figure 4. Age Distribution of the U.S. Population by Origin, 2015

Note: Numbers may not add up to 100 as they are rounded to the nearest whole number.
Source: MPI tabulation of data from the U.S. Census Bureau, 2015 ACS.
 Click here to view an interactive chart showing the age and sex distribution of top origin groups, including the Indian born.
Overall, Indian immigrants have much higher educational attainment compared to the foreign- and U.S.-born populations. In 2015, 77 percent of Indian adults (ages 25 and over) had a bachelor’s degree or higher, compared to 29 percent of all immigrants and 31 percent of native-born adults. Notably, among college-educated Indian immigrants, more than half had an advanced degree.
The high educational attainment of Indian immigrants is a result of the specific channels they use to enter the United States. Many Indians arrived either as international students or H-1B workers, to fill jobs that usually require a university degree, and often stay to pursue permanent residence. Indian citizens were the top recipients of H-1B visas, accounting for 74 percent of the 345,000 petitions (initial and for continuing employment) approved by U.S. Citizenship and Immigration Services (USCIS) in FY 2016.
Nearly 166,000 Indian immigrants were enrolled in U.S. higher education institutions in the 2015-16 school year, comprising 16 percent of the 1 million international students overall. Students from India were the second-largest foreign group after Chinese (328,000), according to the Institute of International Education. Approximately 80 percent of Indian immigrant students were enrolled in STEM majors. Students from India accounted for 14 percent of all temporary visa holders earning doctorates at U.S. colleges and universities in 2015, 85 percent of whom intended to stay in the United States after receiving their degrees, according to the Survey of Earned Doctorates.
The foreign born from India participated in the labor force at a slightly higher rate than the overall immigrant and native-born populations. In 2015, about 68 percent of Indian immigrants ages 16 and over were in the civilian labor force, compared to 66 percent and 62 percent of the foreign- and native-born populations, respectively. Indian immigrants were roughly twice as likely to be employed in management, business, science, and arts occupations, at 73 percent, compared to the overall foreign- and native-born populations, at 31 percent and 38 percent, respectively.
Figure 5. Employed Workers in the Civilian Labor Force (ages 16 and older) by Occupation and Origin, 2015

Source: MPI tabulation of data from the U.S. Census Bureau 2015 ACS.
The median household income for Indian immigrants in 2015 was much higher than that of the overall foreign- and native-born populations. Households headed by Indian immigrants had a median income of $107,000, compared to $51,000 and $56,000 for overall immigrant and native-born households, respectively.
Just 7 percent of Indian immigrants lived in poverty in 2015, a much lower rate than the foreign-born population overall and the U.S. born (17 percent and 14 percent, respectively).
Immigration Pathways and Naturalization
In 2015, 45 percent of the 2.4 million Indian immigrants in the United States were naturalized U.S. citizens, compared to 48 percent of the overall foreign-born population.
Indians are more likely to have arrived in the United States recently, compared to immigrants overall. Thirty-one percent of Indian immigrants arrived in 2010 or later, versus 16 percent of the total foreign-born population. Another 31 percent arrived between 2000 and 2009, and 38 percent before 2000 (see Figure 6).
Figure 6. Indian Immigrants and All Immigrants in the United States by Period of Arrival, 2015

Source: MPI tabulation of data from the U.S. Census Bureau 2015 ACS. Numbers may not add up to 100 as they are rounded to the nearest whole number.
After Mexico and China, India was the third largest country of origin for new lawful permanent residents (LPRs) in FY 2015. More than 64,000 new LPRs, 6 percent of the 1,051,000 total, were from India. Indians who obtained green cards were much more likely to use employment-based preferences than new LPRs overall: Forty-three percent compared to 14 percent, respectively (see Figure 6). Meanwhile, Indian immigrants were less likely than new LPRs overall to obtain green cards as immediate relatives of U.S. citizens (32 percent, compared to 44 percent).
Notably, there were significant backlogs for Indian citizens applying for LPR status through employment-based and family-sponsored channels, due to the annual per-country quota of immigrant visas available for these categories. According to the most recent visa issuance data, in August 2017 the State Department was processing visa applications filed by Indians in September 2003 for some family and employment preferences.
Figure 7. Immigration Pathways of Indian Immigrants and All Immigrants in the United States, 2015

Notes: Family-sponsored: Includes adult children and siblings of U.S. citizens as well as spouses and children of green-card holders. Immediate relatives of U.S. citizens: Includes spouses, minor children, and parents of U.S. citizens. Diversity Visa Lottery: The Immigration Act of 1990 established the Diversity Visa Lottery to allow entry to immigrants from countries with low rates of immigration to the United States. The law states that 55,000 diversity visas in total are made available each fiscal year. Indians are not eligible for the lottery.
Source: MPI tabulation of data from Department of Homeland Security (DHS), 2015 Yearbook of Immigration Statistics (Washington, DC: DHS Office of Immigration Statistics, 2016), available online.
Although the vast majority of Indian immigrants in the United States are legally present, there were approximately 267,000 unauthorized Indian immigrants in the 2010-14 period, according to Migration Policy Institute (MPI) estimates, comprising less than 3 percent of the 11 million unauthorized immigrants in the United States.
MPI also estimated that, in 2016, approximately 15,000 Indian youth were immediately eligible for the 2012 Deferred Action for Childhood Arrivals (DACA) program. However, as of March 31, 2017 (the latest data available from the U.S. government), just 3,741 Indian youth had applied for the DACA program, and 3,182 had been approved.
Indian immigrants were much more likely to have private health insurance than both the overall foreign- and native-born populations (83 percent compared to 55 percent and 69 percent, respectively). They were also less likely to be covered by public health insurance programs and to be uninsured than immigrants overall and the U.S. born.
Figure 8. Health Coverage for Indian Immigrants, All Immigrants, and the Native Born, 2015

Note: The sum of shares by type of insurance is likely to be greater than 100 because people may have more than one type of insurance.
Source: MPI tabulation of data from the U.S. Census Bureau 2015 ACS.
The Indian diaspora in the United States is comprised of approximately 3.9 million individuals who were either born in India or reported Indian ancestry or race, according to tabulations from the U.S. Census Bureau pooled 2011-15 ACS.
Click here to read an in-depth profile of the Indian diaspora in the United States.
While remaining the world’s top recipient of remittances, India experienced a decline in remittance inflows in 2016 for a second consecutive year. Global remittances sent to India via formal channels fell to approximately $63 billion in 2016, a 9 percent decrease from $69 billion in 2015, according to data from the World Bank. The drop owes to low oil prices and weak economic growth in the Gulf Cooperation Council (GCC) countries, where millions of Indian migrants work on temporary contracts. Remittances represented less than 3 percent of India’s gross domestic product (GDP) in 2015. However, at the Indian state level, dependence on remittances varies substantially. For instance, remittances account for an estimated 36 percent of net domestic product in Kerala, and contribute significantly to household consumption.
Figure 9. Annual Remittance Flows to India, 1975 to 2016
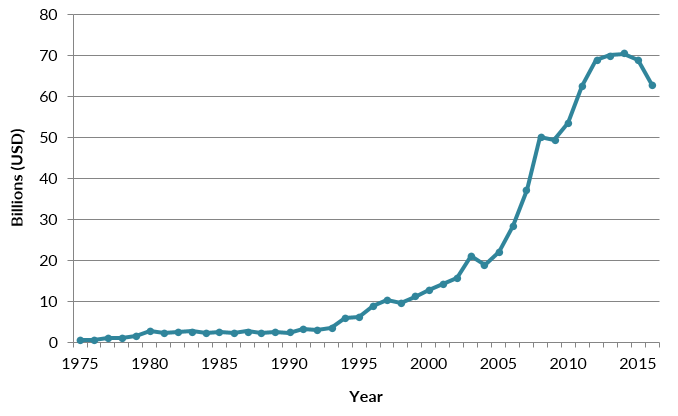
Note: The 2016 figure represents World Bank estimates.
Source: MPI tabulations of data from the World Bank Prospects Group, “Annual Remittances Data,” April 2017 update.
 Three Billboards Outside Ebbing, Missouri after only a few minutes becomes a story of real people living their anger, pain, loss, illness, and even dark humor before our eyes. In fact, the audience shares in their reactions as we are also called to view these emotions and events through our own experiences. How sympathetic and empathetic am I to others pain and grief?